Course overview
1. What is technical analysis?2. Technical Analysis Fundamentals / Price charts and indicators / Desktop3. Key Chart Patterns4. The importance of confluence 5. Conclusion2. Technical Analysis Fundamentals / Price charts and indicators / Desktop
Understanding price charts
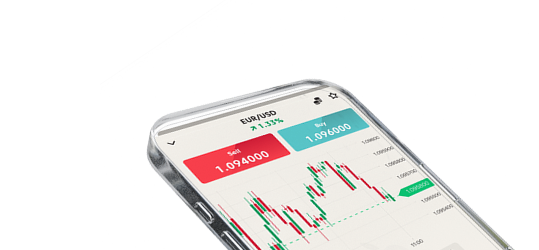
Price charts provide a visual representation of an asset’s price movement over time. Depending on their personal preference and trading style, traders have three main options at their disposal: candlestick charts, bar charts, and line charts.
Candlestick charts are the most information-dense, displaying the open, close, high, and low price for each interval (the time period represented by each bar or candlestick). The body of the "candle" is either filled, or coloured green or red, to indicate if the close was higher or lower than the open. Wicks extend above and below the body of the candle to show the interval’s highs and lows.

Bar charts provide a similar level of detail but have a slightly simpler appearance. They use horizontal lines for the open and close prices, and a vertical line to represent the highs and lows within that period.

Line charts take the simplest approach, connecting the closing prices for each time period with a single line. While they are useful at displaying long-term trends, they lack the detail provided by candlestick or bar charts.

Read more about Share Trading
How to Read Candlestick Patterns & Charts When Trading / Axi
How to Read Forex Charts - FX Trading Chart Analysis / Axi
Support and resistance
Support and resistance are like invisible boundaries on a chart. Support zones are areas where falling prices tend to bounce back up, while resistance zones might cause prices to stall or even reverse downward. Identifying these past price levels allows traders to spot potential entry and exit points.

Testing boundaries
Support and resistance boundaries get weaker the more times they are tested, as the pool of potential buyers (at support) or sellers (at resistance) can get depleted.
Spotting the direction: up, down, or sideways?
Identifying trends is a fundamental skill in technical analysis (TA). Trends help us understand the overall direction of price movements and potentially predict future price action. Here is a breakdown of the three main trend types:
Uptrends are bullish, with higher highs and lower lows over time. They can be visualised by drawing a trendline along the bottoms of price swings, connecting the lows.
Downtrends are bearish, with lower highs and lower lows over time. They are often seen as selling opportunities as the price falls.
Consolidation is a period of sideways price movement, signalling a pause before the continuation of the previous trend or a potential trend change.
To identify trends, use multiple timeframes (such as daily and hourly) and focus on the bigger picture and established trendlines. Be aware of false breakouts, which occur when the price momentarily surpasses a support or resistance level before reversing back into the trend.
Key Technical Indicators
Let’s explore some of the most useful indicators available in a CFD trader’s toolbox:
Moving Average (MA) is a widely used momentum indicator that serves as the foundation for many other technical indicators, such as the MACD and Bollinger bands.
MAs, often known as ‘lagging’ indicators, track the trend rather than predicting price direction, smoothing out price data in the process. Each MA is formed by averaging the price over a certain number of periods. When a short MA crosses a long one, a strategic crossover signal is created. A bullish Golden Cross is formed when a shorter MA (e.g., 50) crosses above a longer one (e.g., 200), while a bearish ‘Death Cross’ is formed when the shorter MA crosses below a longer one.

MACD (Moving Average Convergence Divergence) combines several moving averages to show the relationship between short-term and long-term price changes. It can be used to detect potential trend reversals and generate buy/sell signals.
Relative Strength Index (RSI) measures the momentum of price movements and may help identify overbought or oversold conditions.
Bollinger Bands consist of three lines and measure an asset’s volatility. They consist of a simple MA in the middle, and upper and lower bands, which expand and contract as price gets more or less volatile, respectively. Touching the upper band indicates the asset is overbought, while touching the lower band indicates it is oversold, potentially signalling reversal points.

Quiz
1/1
Which type of chart offers traders the most information?
Candlestick charts, as they display the open, close, high, and low price for each time period.