Course overview
1. What is technical analysis?2. Technical Analysis Fundamentals / Price charts and indicators / Desktop3. Key Chart Patterns4. The importance of confluence 5. Conclusion1. What is technical analysis?
Level
Beginner’s
Time
30 minutes
Quiz
Test your skills
Course summary
This course gives you an overview of the fundamental elements of technical analysis, such as identifying trends and trading opportunities, understanding price charts and decoding price movements, so that you gain an edge in the markets.
Technical analysis (TA) is the study of past price and volume patterns, in order to evaluate investments and forecast price movements.
In CFD trading, TA is a powerful tool that can help investors predict future trends, potentially leading to profitable trades. The specific benefits of TA for traders include:
- Allows traders to visualise price movements and identify uptrends and downtrends.
- Assists traders in spotting optimal entry and exit points by helping with timing decisions to buy low and sell high.
- Provides insight into market sentiment by analysing price and volume data.
- Supports in risk management by helping to set stop-loss orders, which automatically exit a trade if the price goes against the trader, limiting potential losses.
“The trend is your friend”
As commonly said by investors and traders, “The trend is your friend.” This means that following the prevailing market trend can potentially be a profitable strategy.
Technical Analysis vs Fundamental Analysis
Beyond technical analysis (TA), traders also use fundamental analysis (FA) to evaluate potential investments. Fundamental analysis assesses an asset’s financial health, future growth potential, and the broader economic context. It combines financial statements, industry reports, and economic data to determine if an asset is undervalued or overvalued. This long-term perspective makes FA ideal for investors with a buy-and-hold strategy.
| Feature | Trading (Share CFDs) | Investing (Shares) |
|---|---|---|
| Focus | Market sentiment and past price movements | Intrinsic value of an asset |
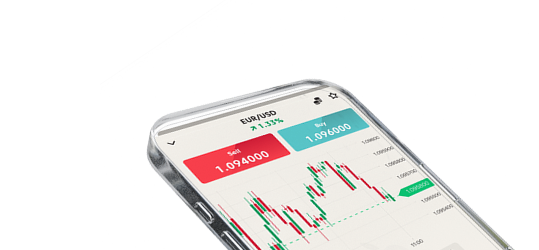
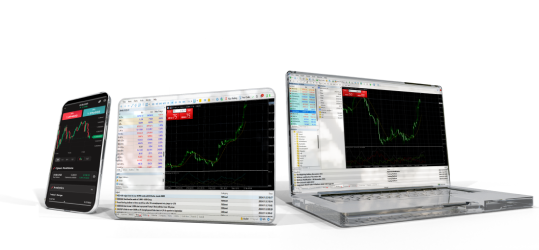
| Information | Price charts and technical indicators | Financial statements and news |
| Goal | Identify trading opportunities | Identify undervalued and overvalued assets |
| Timeframe | Short-term (day trading) or mid-term | Long-term (months or years) |
Both FA and TA have their advantages, and some investors even use a combination of both approaches for a more well-rounded analysis.
Quiz
1/1